Wind resource, wake losses and model resolution are usually fixed early and left alone. If they move system cost and technology mix as much as the assumptions modellers do argue about, they deserve the same scrutiny.
Work / PyPSA-Eur fork · PhD Part II
How wind representation moves energy system plans
Energy system models plan decades of investment on wind inputs that are rarely questioned. I extended PyPSA-Eur to test how much three of those inputs, reanalysis bias, wake losses and spatial resolution, change the answer.
- Period
- PhD, 2021 – 2026
- Stack
- Python · PyPSA · Atlite · Snakemake · Gurobi · GeoPandas · Xarray · pytest
Problem
Approach
- Integrated the gridded PyVWF corrections into the PyPSA-Eur wind resource pipeline, upstream at wind-speed level.
- A density-tiered wake-loss correction where losses scale with installed capacity density rather than absolute capacity, which makes it consistent across resolutions by construction. The underlying physical relation came from a postdoctoral colleague; the density-tiered form and its implementation in PyPSA-Eur are mine.
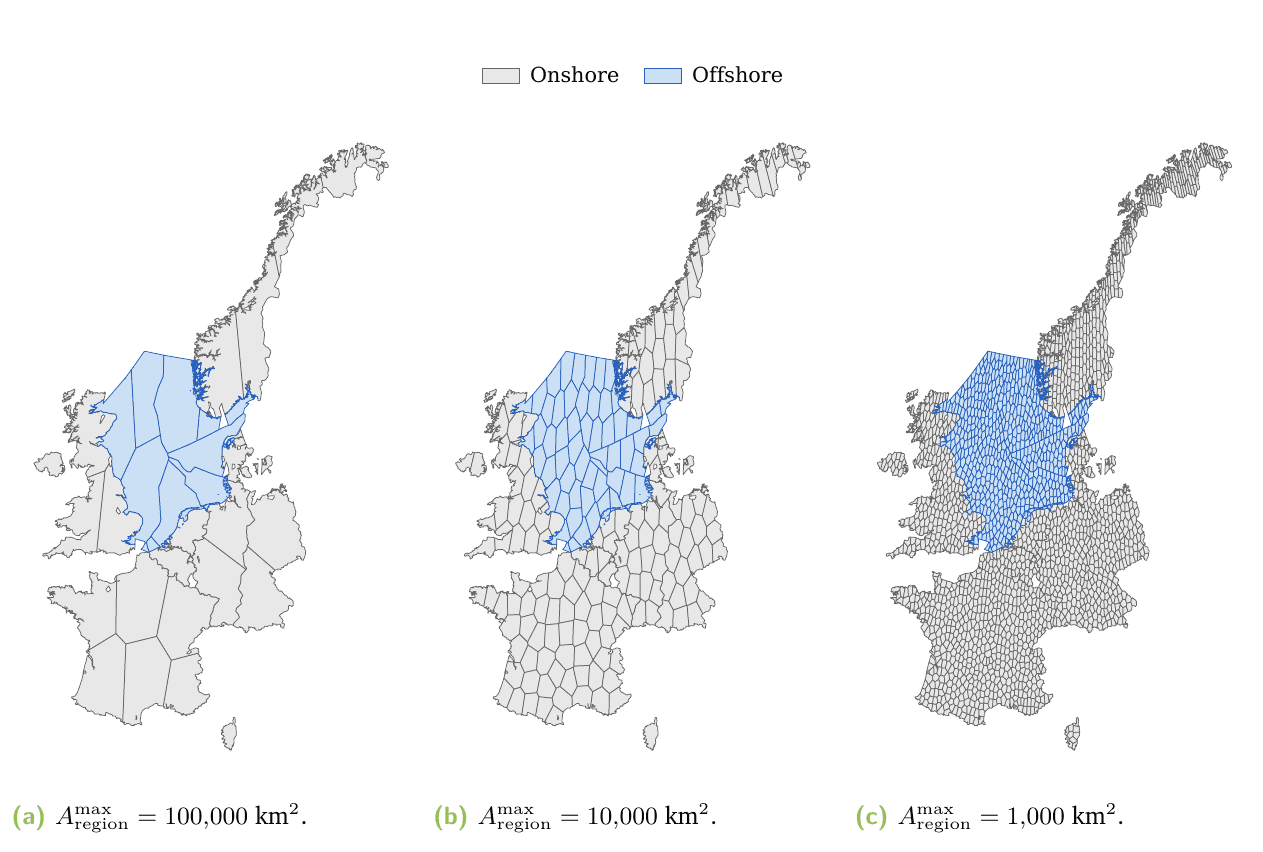
- A spatial splitting algorithm that decouples offshore wind resource resolution from network topology, so offshore detail can increase without redrawing the grid.
- A factorial design, bias × wake × resolution, run on a regional sector-coupled North Sea system and a 25-country continental network.
Validation
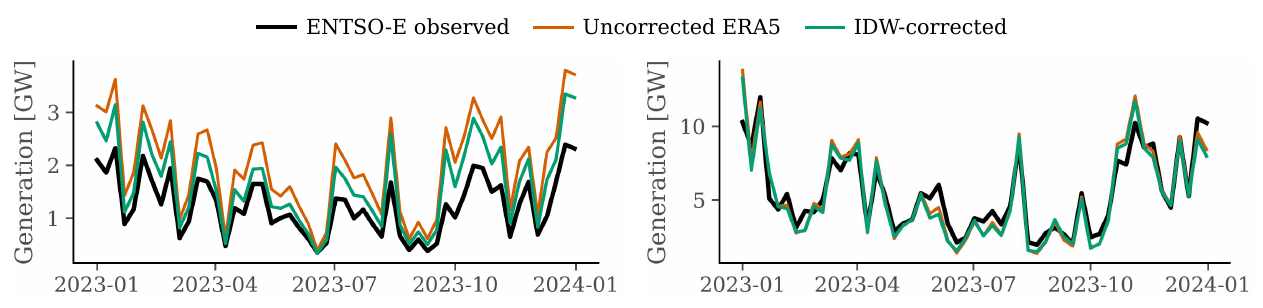
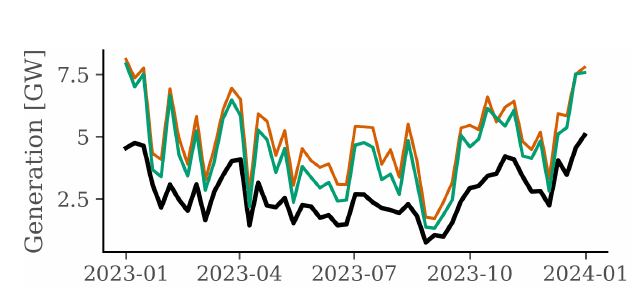
- Modelled capacity factors compared against hourly generation across 23 countries onshore and 7 offshore.
- The corrected model improved accuracy in 9 of 11 country and technology combinations, cutting NRMSE by up to 36%.
- At fine resolution, Pearson correlation was 0.90 or above for Germany, Denmark, the Netherlands, Belgium and Ireland, and barely moved across configurations: the corrections change the magnitude of generation without distorting the timing of wind events.
- On magnitude, combined bias and wake corrections brought mean bias error for Belgium offshore from +49% to +15%, and Denmark from +44% to +12%.
Results
- Wake losses dominate the technology mix at every scale, reducing offshore wind capacity by 36 to 46% and raising onshore deployment by up to 113%. At continental scale they are also the largest cost driver, at +2.9%.
- Bias correction is the largest cost driver regionally, +2.76% at fine resolution. At continental scale the same correction nets −0.1%, because it moves capacity from over-estimated offshore sites to under-estimated onshore ones rather than penalising wind everywhere.
- Interactions are slightly sub-additive: +4.32% combined at regional fine resolution, and +2.4% at continental scale, less than wake losses alone.
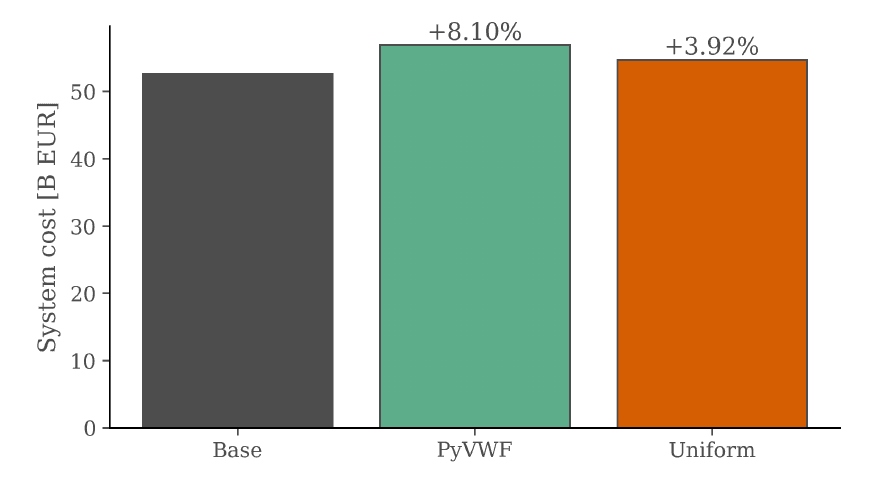
- In a seven-country electricity-only North Sea system, spatially resolved correction changed total system cost by 8.1%, more than twice the effect of uniform scaling.
- Coarse resolution dampens both signals and finer resolution amplifies them, so the three choices behave as coupled levers rather than independent refinements.
Reading
These results do not show that earlier studies were wrong. The models are large, with many interacting assumptions, and are used to plan systems that do not exist yet. The honest reading is a sensitivity result: wind resource representation belongs alongside discount rates, capital cost projections and fuel prices as a leading-order assumption.
Engineering
- Worked inside PyPSA-Eur's conventions, as a public fork, rather than around them.
- The analysis layer is mine: 36 Python files and 12,960 lines organised as packages, with 112 tests.
- Every manuscript figure and the metrics table regenerate from a named data directory through one script, and the headline claims are held under automated test with tolerances.
Limits
Computational cost is the binding constraint at continental scale. The next step is adaptive, multi-resolution modelling that adds spatial detail only where it matters to the system.
More work
Open-source library · Author
PyVWF: bias-corrected wind power from reanalysis
ERA5 is the default input for simulating wind power, and its wind speeds are biased in ways that change with place and season. PyVWF learns those biases from observed generation and corrects them, at whatever spatial and temporal resolution the data can support.
Post-PhD research · experimental
Transferring wind corrections to places with no observations
Bias corrections only exist where there is observed generation to learn from. This work asks whether a constrained, physics-informed model can carry a correction to a region it has never seen, and fixes the tests before running them.